Madison Lake Shoreline Analysis
Madison Shoreline Changes 1937-2017
By: Evan Kebus
Introduction:
This is a study of shoreline changes on Lake Mendota and Lake Monona over the past 80 years. Living in Madison all my life and constantly fishing and boating on Lake Mendota and Lake Monona drove me to peruse this project. After the flash floods in August-September 2018 my curiosity grew about why the flooding was so severe and how the shoreline of the Madison Lakes had changed over time. This is an analysis of the shorelines of two lakes in Madison, Wisconsin. One map is a mosaic of aerial images from a biplane taken in 1937. The other is an orthographic satellite image taken in 2017. These maps will be used to compare and analyze any major changes along the shoreline.
1937

2017

Overview:
Lake Mendota is the larger northern lake and Lake Monona is the smaller southern lake. The Yahara River connects these two bodies of water and runs through the city of Madison, Wisconsin which resides on the isthmus.
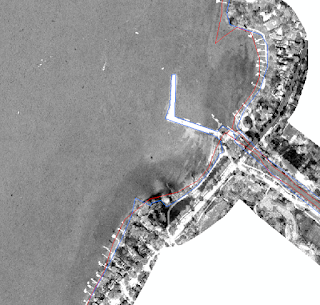
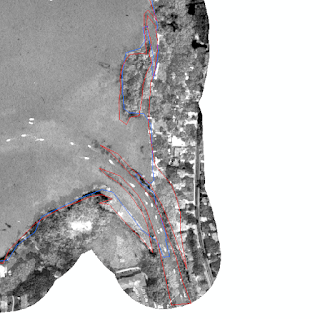
 Shoreline Comparison with ArcMap 1937(Red) - 2017(Blue):

Findings of Shoreline Change from 1937(Red) - 2017(Blue):
Research Questions:
How have Lake Monona and Lake Mendota’s shorelines changed over the past 80 years? (1937-2017)
Which changes are most significant and what are the possible causes of these changes?
Finding 1: Northern Lake Mendota/Yahara River


Finding 5: South Eastern Lake Monona


Finding 7: South Eastern Lake Monona

Step 1: Data points of all the aerial photos from 1937 in Dane County were collected by the Wisconsin Historic Aerial Imagery Finder. The photos needed to create this map were selected and downloaded.
Implications of Results:
References:
By: Evan Kebus
Introduction:
This is a study of shoreline changes on Lake Mendota and Lake Monona over the past 80 years. Living in Madison all my life and constantly fishing and boating on Lake Mendota and Lake Monona drove me to peruse this project. After the flash floods in August-September 2018 my curiosity grew about why the flooding was so severe and how the shoreline of the Madison Lakes had changed over time. This is an analysis of the shorelines of two lakes in Madison, Wisconsin. One map is a mosaic of aerial images from a biplane taken in 1937. The other is an orthographic satellite image taken in 2017. These maps will be used to compare and analyze any major changes along the shoreline.
1937
2017
Overview:
Lake Mendota is the larger northern lake and Lake Monona is the smaller southern lake. The Yahara River connects these two bodies of water and runs through the city of Madison, Wisconsin which resides on the isthmus.
Shoreline Comparison with ArcMap 1937(Red) - 2017(Blue):Findings of Shoreline Change from 1937(Red) - 2017(Blue):
Research Questions:
How have Lake Monona and Lake Mendota’s shorelines changed over the past 80 years? (1937-2017)
Which changes are most significant and what are the possible causes of these changes?
Finding 1: Northern Lake Mendota/Yahara River
- The Yahara River mouth was expanded
- Peninsula was submerged/eroded
- Good example of area increase with shoreline decrease


Finding 2: Eastern Lake Mendota
- Instillation of Tenny Park boat launch and dock
- Shoreline eroded/submerged


Finding 3: Western Lake Mendota
- Inlet created with boat launch access
- Indication of increased boat traffic and shoreline housing with boat docks and lake access


Finding 4: Northern Lake Monona
- Instillation of Olbrich Park boat launch and pier
- Indication of increased boat traffic
- Shrinking width of Stark Weather Creek


Finding 5: South Eastern Lake Monona
- Neighborhood remained the same with the creation of Winnequah Park
- Winnequah Creek decreased in width


Finding 6: South Eastern Lake Monona
- New inlet created in Squaw Bay
- Peninsula was turned into an island due to rising water levels and erosion


Finding 7: South Eastern Lake Monona
- Peninsulas on the mouths of the southern outlet of the Yahara River were submerged/eroded
- Good example of perimeter decrease


Methods:
Step 2: Then these photos of the Madison lake area were georeferenced. In this process road lines from a ArcGIS base map are matched with corresponding roads that appear on the aerial photograph.
Step 3: Next the aerial photos were clipped the georeferenced in order to isolate the usable area in the photo leaving out the edges of the photographs and the time stamps.
Step 4: After the images were georeferenced and clipped, the images were rastered and mosaiced to create a seamless single image.
*Raster: A collection of images.
*Mosaic: A combination of images merged together to create a single seamless image
Step 5: The finished mosaic of the Madison lakes from aerial images from 1937 was used to for further analysis and comparison. These images were processed as an ESRIBil. Then a polygon feature was created which closely followed the shoreline in order to process the mathematical portion of this project.
Step 6: An orthographic image from 2017 of the same Madison lakes study area was downloaded from the National Agriculture Imagery Program (NAIP). This image was also processed as an ESRIBil. Then following the same process as before a polygon feature was created for the 2017 orthographic image which closely followed the shoreline in order to process the mathematical portion of this project.
Step 7: These two images were overlaid in order to illustrate spatial change.
Step 8: Fields for area and perimeter of Lake Mendota and Lake Monona were added to the attribute table in ArcMap
Step 9: Using the calculate geometry function ArcMap was able to calculate the area and perimeter for Lake Mendota and Lake Monona for 1937 and 2017.
Step 10: Finally with visual and mathematical data my results were ready to be analyzed and this allowed me to select areas of major change.
Conclusion:
- Area increased by 141,177.62 square meters from 1937 to 2017
- Perimeter decreased by 1,136.41 meters from 1937 to 2017
- Population growth in the Madison area
- Expansion of the Yahara River
- Rising water levels have overtaken smaller peninsulas and pushed back the shoreline of the isthmus
- Shoreline development and increase in boat traffic
- How has the severe flooding that occurred in Madison August – September 2018 affected the shoreline?
- Recreate this process with data from 2018
References:
- NAIP: https://www.fsa.usda.gov/programs-and-services/aerial-photography/imagery-programs/naip-imagery/
- WHAIF: https://maps.sco.wisc.edu/WHAIFinder/#7/44.750/-89.750
- Base map: U.S. Census Bureau


Comments
Post a Comment